Third blog post in a series of 3. Read part 1 and part 2 here.
In the last two blogs, we introduced the concept of Entropy in decentralised governance. We discussed that the transition from Low Entropy (form, structure and order) to High Entropy (randomness and disorder) appears to have an inverse correlation with regulatory accountability for decentralised ecosystems.
In the last blog, we concluded that coining the term Entropy and the parameters, which play into the increase of Entropy will be something that will help decentralised governance ecosystems achieve greater clarity going forward.
In this blog, we are going to lay out exactly how we are modelling Entropy at cheqd.
Researching models of decentralisation
Decentralisation is something that has been analysed previously across blockchains, generally for Bitcoin and Ethereum.
In the course of our own modelling, we have made reference to a range of previous work to inform our decision making.
One notable research paper into decentralisation was conducted by Beijing Jiaotong University, which looked at the decentralisation of Ethereum through the lens of three metrics:
1. The Nakamoto coefficient
The minimum number of Entities required to collude to reach over 51% of the overall Network voting power.
2. Gini coefficient
The economic inequality and measure of wealth distribution among an ecosystem.
3. Sharron Entropy
The degree of randomness in the distribution of voting power.
These metrics are defined through mathematical formulae and are plotted against time over the course of 1 year. This enables the reader to see the change in decentralisation clearly for each particular metric. This analysis is certainly a useful starting point. However, reaching values and conclusions from these metrics is difficult for a layperson, and the value behind the graphs is complex at face value.
Moreover, the calculations only pinpoint decentralisation with reference to one metric, rather than facilitating an overall framework for modelling decentralisation, based on a combination of metrics.
For this reason, we did not want to focus our attention on meticulously calculating specific metrics in isolation, especially since a complex mathematical model is not particularly inclusive and accessible for the wider audience.
Another research paper from the School of Electrical Engineering, Korea University focuses on two metrics, namely:
- Censorship resistance
- Geographic diversity
Again the research paper tries to model these metrics using mathematical Lorenz Curves — comparing theoretically perfect decentralisation against actual decentralisation.
And while the model provides another reference point, it is not something that we think is easily understood or replicated.
When modelling the level of decentralisation through Entropy, one important factor in determining the model was: it needs to be intuitive, simple and easily digestible.
Throughout our entire Governance Framework, this is a core principle.
One more article that we have taken influence from was Measuring Blockchain Decentralization written by Consensys.
This article focussed solely on Ethereum, breaking its decentralised down into four broad categories and smaller subcategories:
- Protocol
– Consensus algorithm
– Function call diversity
– Mining/stake diversity & growth
– Network usage
– Number of clients - Nodes
– Active node count
– Node size
– Node distribution & growth by country - Ecosystem
– Total developers, Monthly
– Account growth
– Account active vs passive
– Number of companies on, which project relies
– Diversity & strength of power infrastructure - Token/Coin
– Token ownership
– Token trading volume
This article very well encapsulates how each metric changes over time, making it clear and accessible to understand.
However, it does not rank Ethereum’s decentralisation in its entirety, but hones in on facets of its decentralisation. This analysis, while very strong and thorough, does not help simply contextualise the overall decentralisation of Ethereum.
It also does not give reference points as to what constitutes low or high levels of decentralisation, which makes it difficult to gauge whether a high and low flux in a year is actually reaching any significant points.
As such, although these three models do provide useful points of reference, we have decided not to go down the same route.
A more digestible model
So, where did we land with our modelling framework for Entropy?
We wanted to build something more visual and accessible than an algorithm or formula; something that could be easily applied to multiple blockchains and utilised by any layperson.
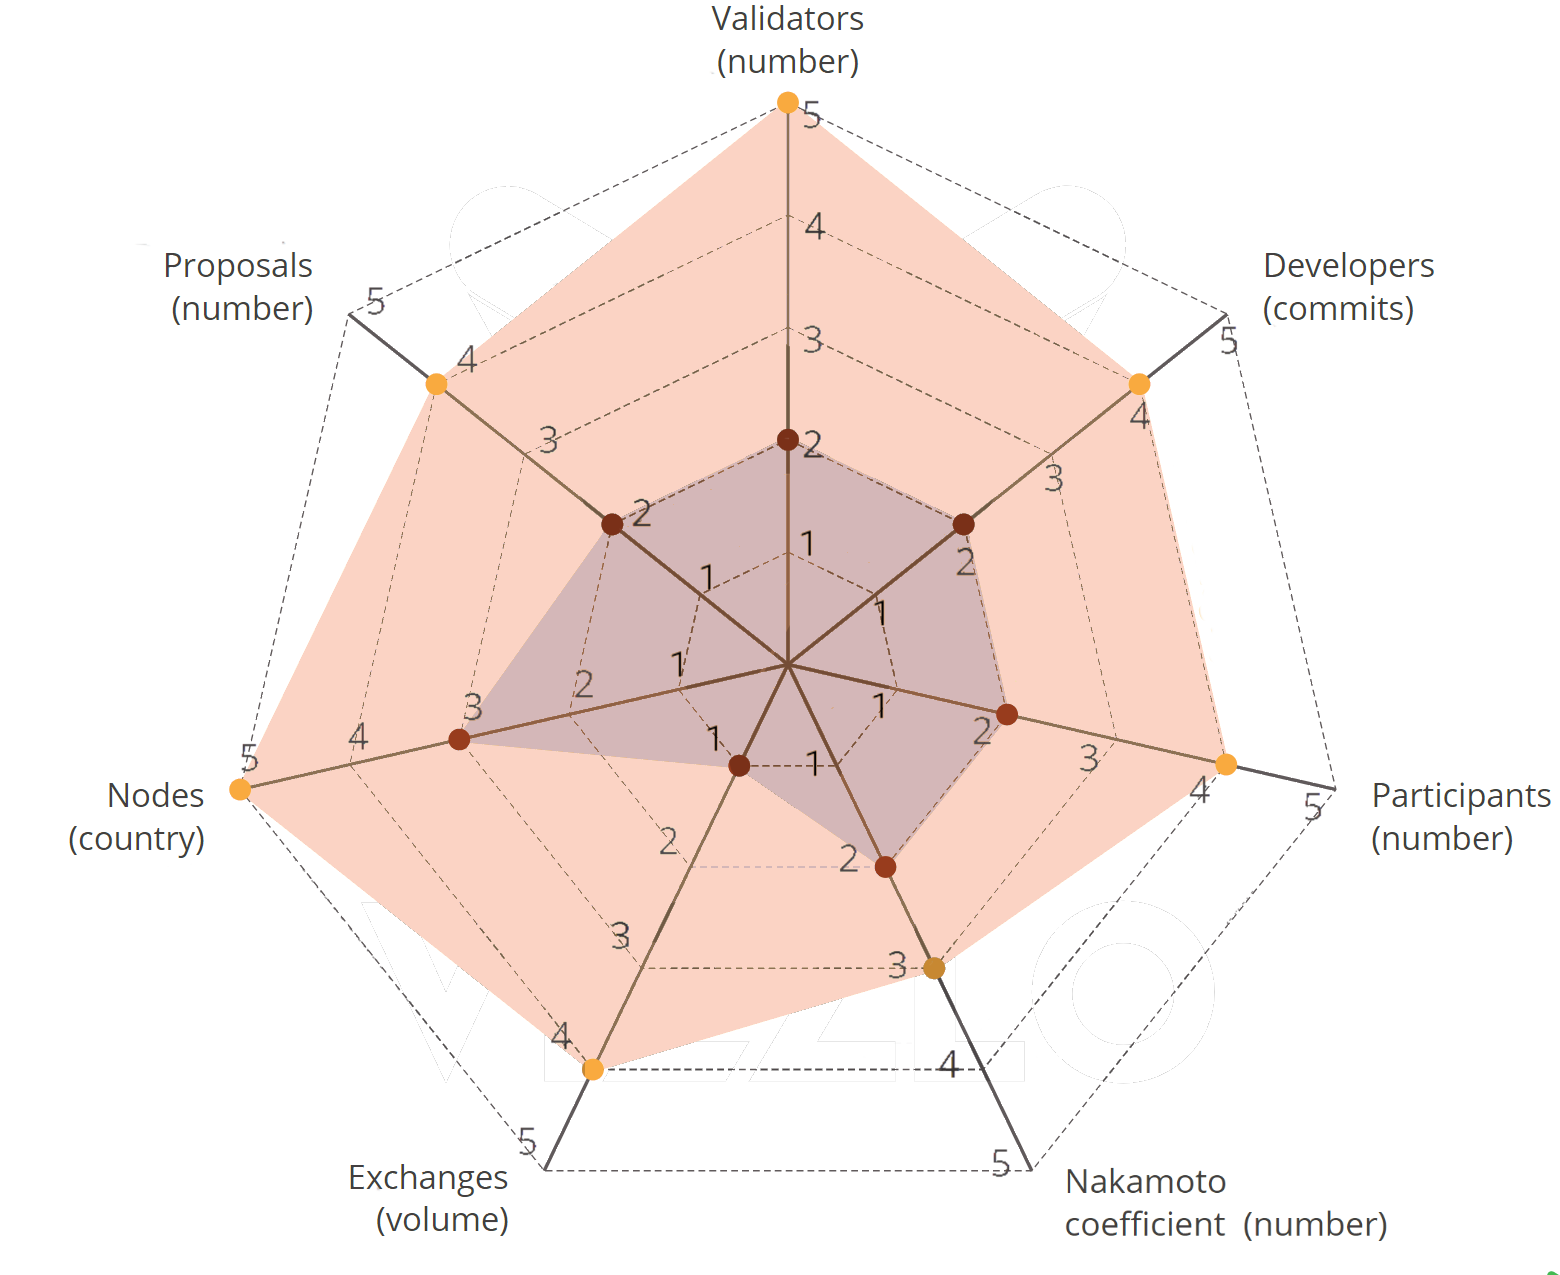
Where we landed was: a Scorecard
The spider diagram above, the Entropy Scorecard, shows a scale scoring from 1–5 which we refer to as Entropy Levels, measuring tangible decentralisation from a genesis state (and Low Entropy) to what we believe is beyond the point of sufficient decentralisation (and High Entropy).
At each point on the diagram sits a different metric of measurement. It is important to note that we could have selected more, fewer or different metrics to calculate Entropy against. We could have, for example, taken all of the metrics used by Consensys in their analysis into account or as few a smaller sample of more nuanced metrics like those used by Beijing Jiaotong University.
Instead, we chose the seven metrics listed below because they provide a very sensible, digestible foundation for a rough calculation of cheqd’s Entropy. These metrics cover each angle of the Network, from security to activity to geography to governance.
We would absolutely welcome suggestions and feedback from the community to further refine this list going forward. Get in touch with us using our Governance discussions forum here.
We will walk through our reasoning behind each choice:
1. Validators (number)
This is the number of Node Operators on the Network. This is significant because the composition of Node Operators on the Network has a direct relationship with the dilution of voting power. The greater the number of Node Operators, the:
i. Greater choice the token holders have in who to bond and delegate tokens to for the purpose of Network Governance.
ii. Greater the strength of security on the Network, with fewer points of failure.
2. Developers (commits)
This is the number of commits made on the source code after launch via cheqd’s open-source repositories. Ideally, we would also be able to measure the amount of commits made by developers outside the core team of cheqd. Commits from developers outside cheqd add healthy randomness to the code and the development of the Network.
3. Participants (number)
This is the number of bonded token holders, meaning the Network Users who have bound a portion of their tokens to a Node Operator in order to participate in Governance.
This is important because the larger the pool of Participants, the more the voting power will become diluted across the Network, since Participants are able to vote unilaterally, regardless of the Node Operator they are bonded to.
4. Nakamoto coefficient (number)
Taken from previous work done on blockchain decentralisation, this is the minimum number of Entities in the Network that can pool together to reach a 51% stake on the Network. The higher the number here, the more the Network is secure against malicious attacks, a network monopoly, and undesirable breaking changes.
5. Exchanges (volume)
Exchanges are closely correlated with the accessibility of the token. Being able to buy and sell CHEQ on an exchange will open the token up to a larger range of Users. A higher number of exchanges will lead to a healthier split of stake, with hypothetically, lower volume across each exchange.
6. Nodes (country)
The geographical makeup of the Network is important when discussing decentralisation. This is because geographic diversity lends itself to the diversity of thought and perspective. A geographically diverse Network also increases the security of the Network, because even if an entire country was to shut its entire infrastructure down, a multijurisdictional Network would continue to function resolutely.
7. Proposals (number)
Like developer commits, Network Governance Proposals transition the Network away from its genesis state to a more random and disordered Entity. This again is very important in removing the initial control and order that the cheqd core team has implemented into the genesis state of the Network.
The Proposal and Voting process on cheqd is based on a liquid democracy. As a result, the more decisions are made through this process, the more control is taken away from a centralised collective and moved to the consensus of a wide-barrelled and diverse group of Participants.
Calculating Entropy
Having laid out the distinct metrics used to constitute Entropy, it is important to lay out the values that define each Entropy Level. These values are specific to cheqd and the levels of decentralisation we would like to eventually reach.
These values have been calculated by us looking at our end goal, taking the point at which we feel we could be maximally or sufficiently decentralised, and scaling backwards.
The values that we have chosen are as follows:
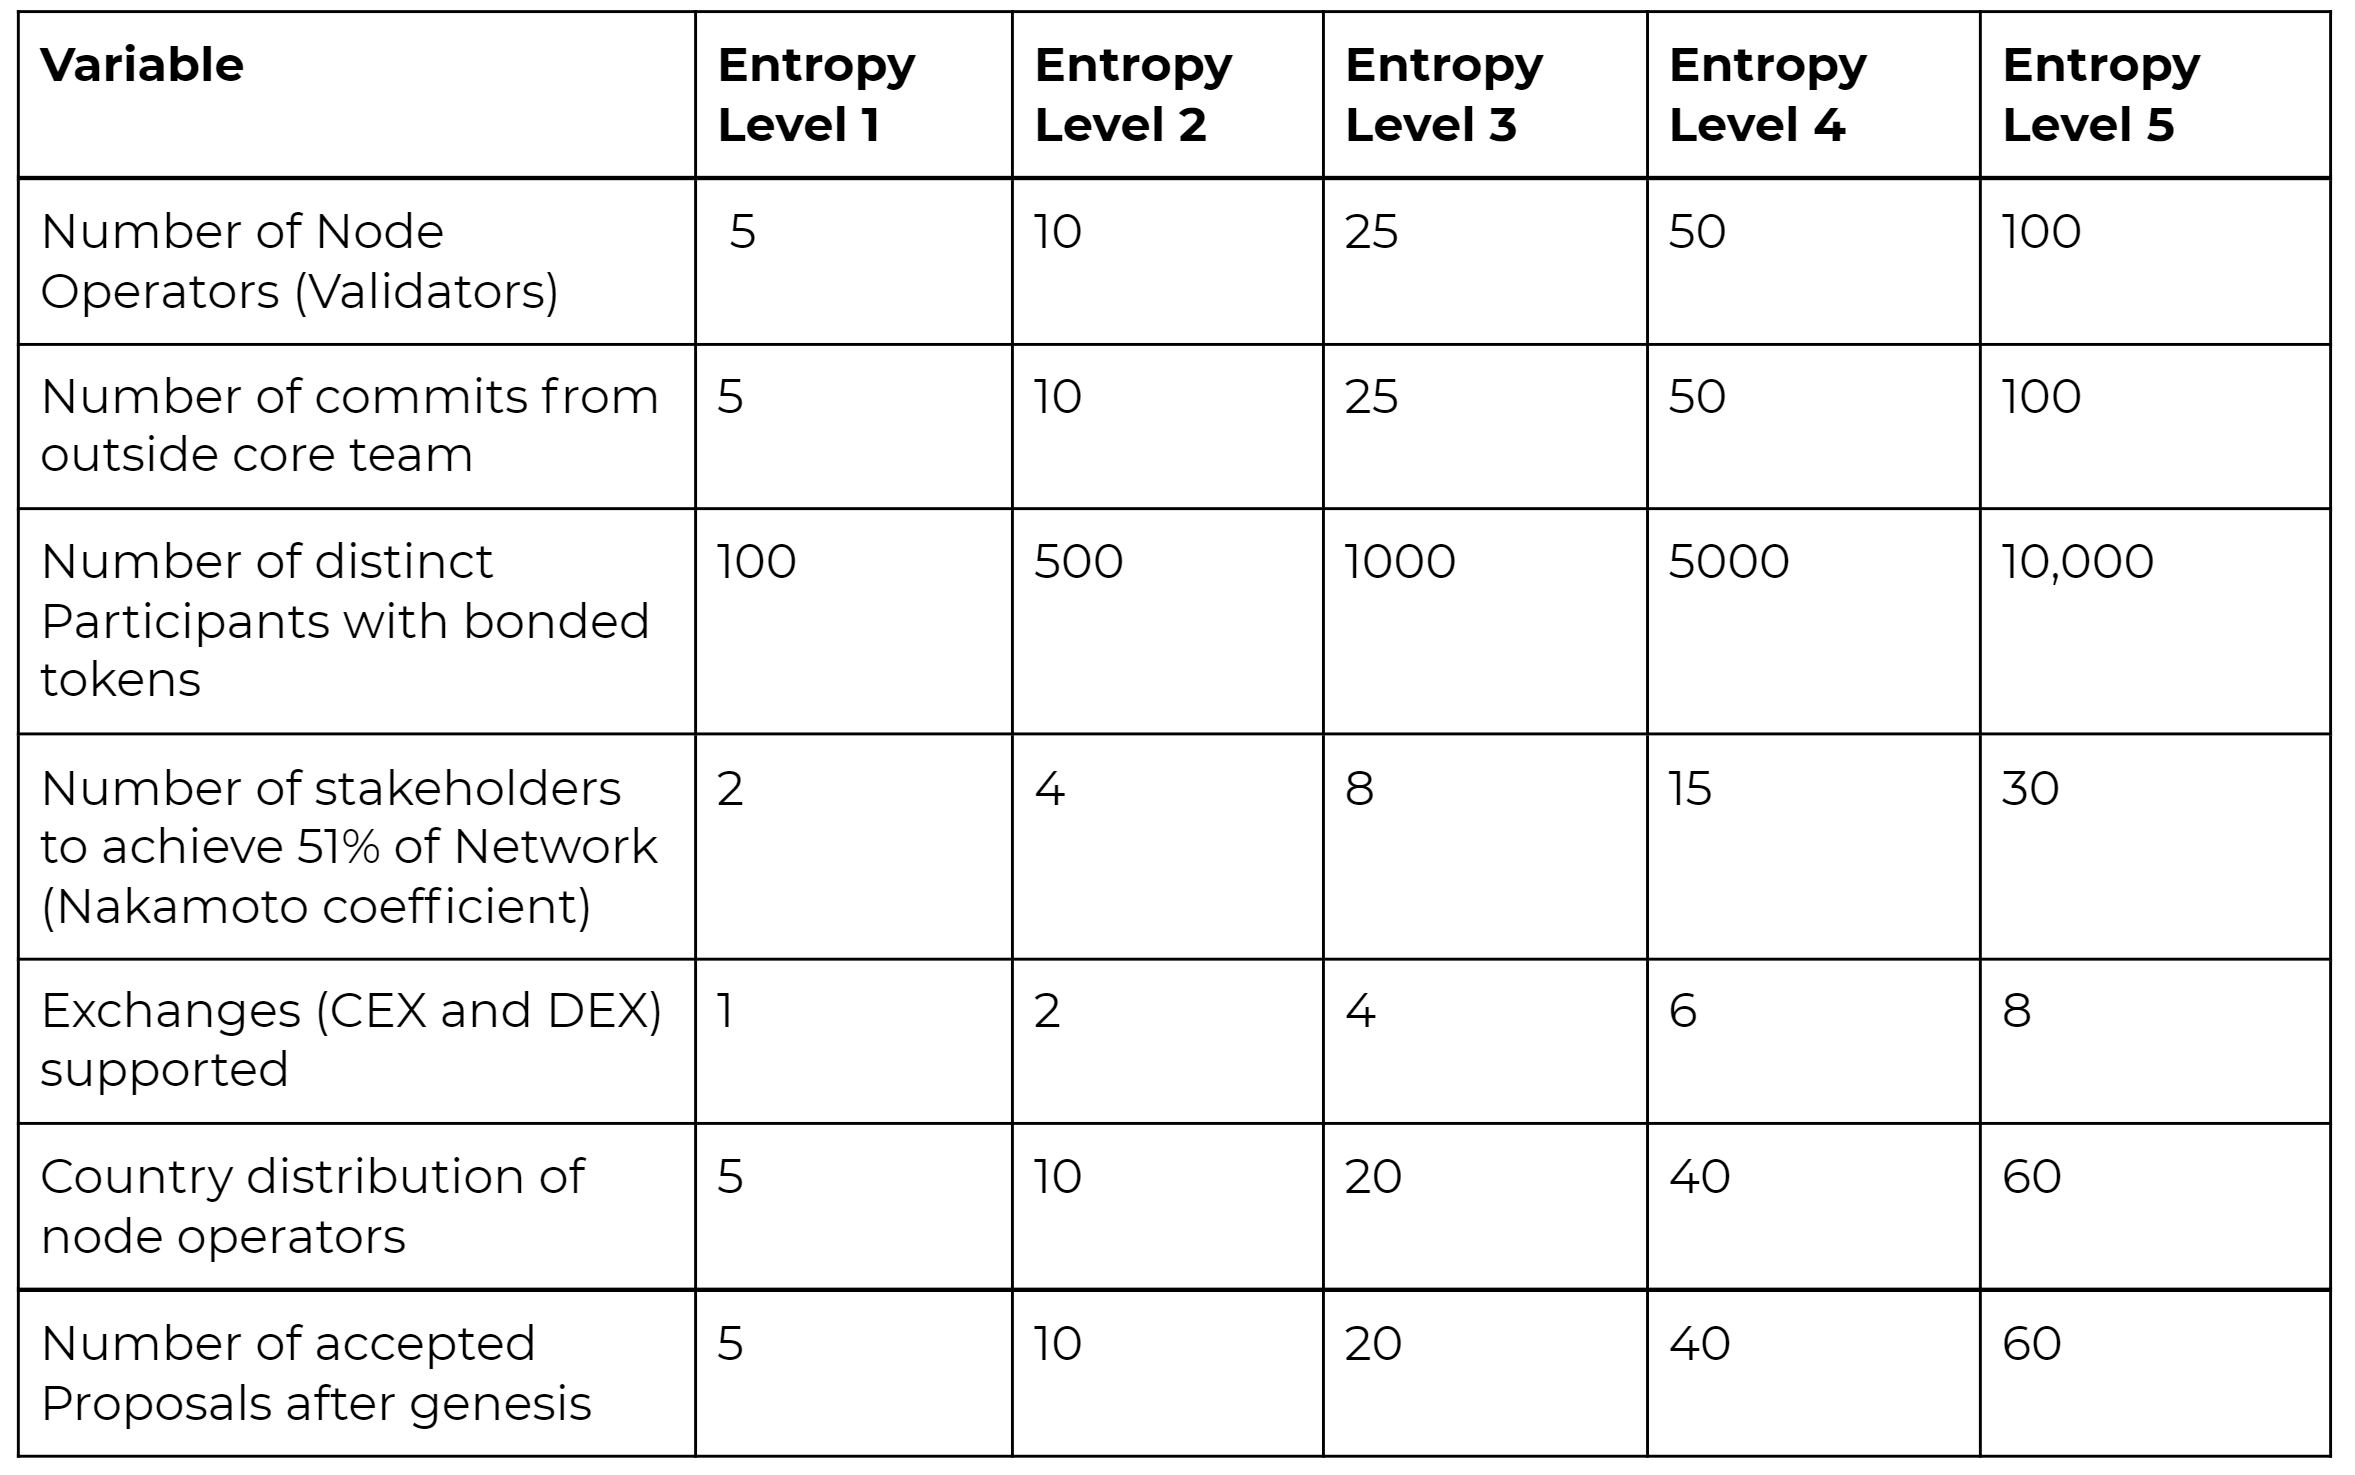
Entropy score table
To ‘score’ Entropy, you need to add the total sum of the Entropy Level across each metric.
For example, the highest level of decentralisation a Network could reach according to this model would be Entropy Level 5 in all seven metrics — totalling a score of 35. Whilst the lowest level a Network could have would be Entropy Level 1 in all seven metrics — totalling a score of 5.
We would also love to see other Networks applying the same scorecard model of Entropy to exhibit their Network’s level of decentralisation, and whilst slight changes may need to be made to accommodate for nuances in different Networks, the core concept can remain the same.
Over time, we do expect this initial table to be iterated, extended and revised as decentralised ecosystems, in general, become more mature, more distinct and as opinion from Regulators, such as the Security and Exchange Commission (SEC) becomes more clear.
Entropy Progression
Where we are
Like any other blockchain Network, cheqd will begin its life cycle with a Low Entropy score. This is absolutely normal for the genesis of a decentralised Network, as the core team will have put in the default parameters, meaning there will be a higher locus of control, and change has not yet been made via the governance framework processes.
We envision that our Entropy score at launch will likely be lower than 14.
A low entropy score as such can be represented by the scorecard below:
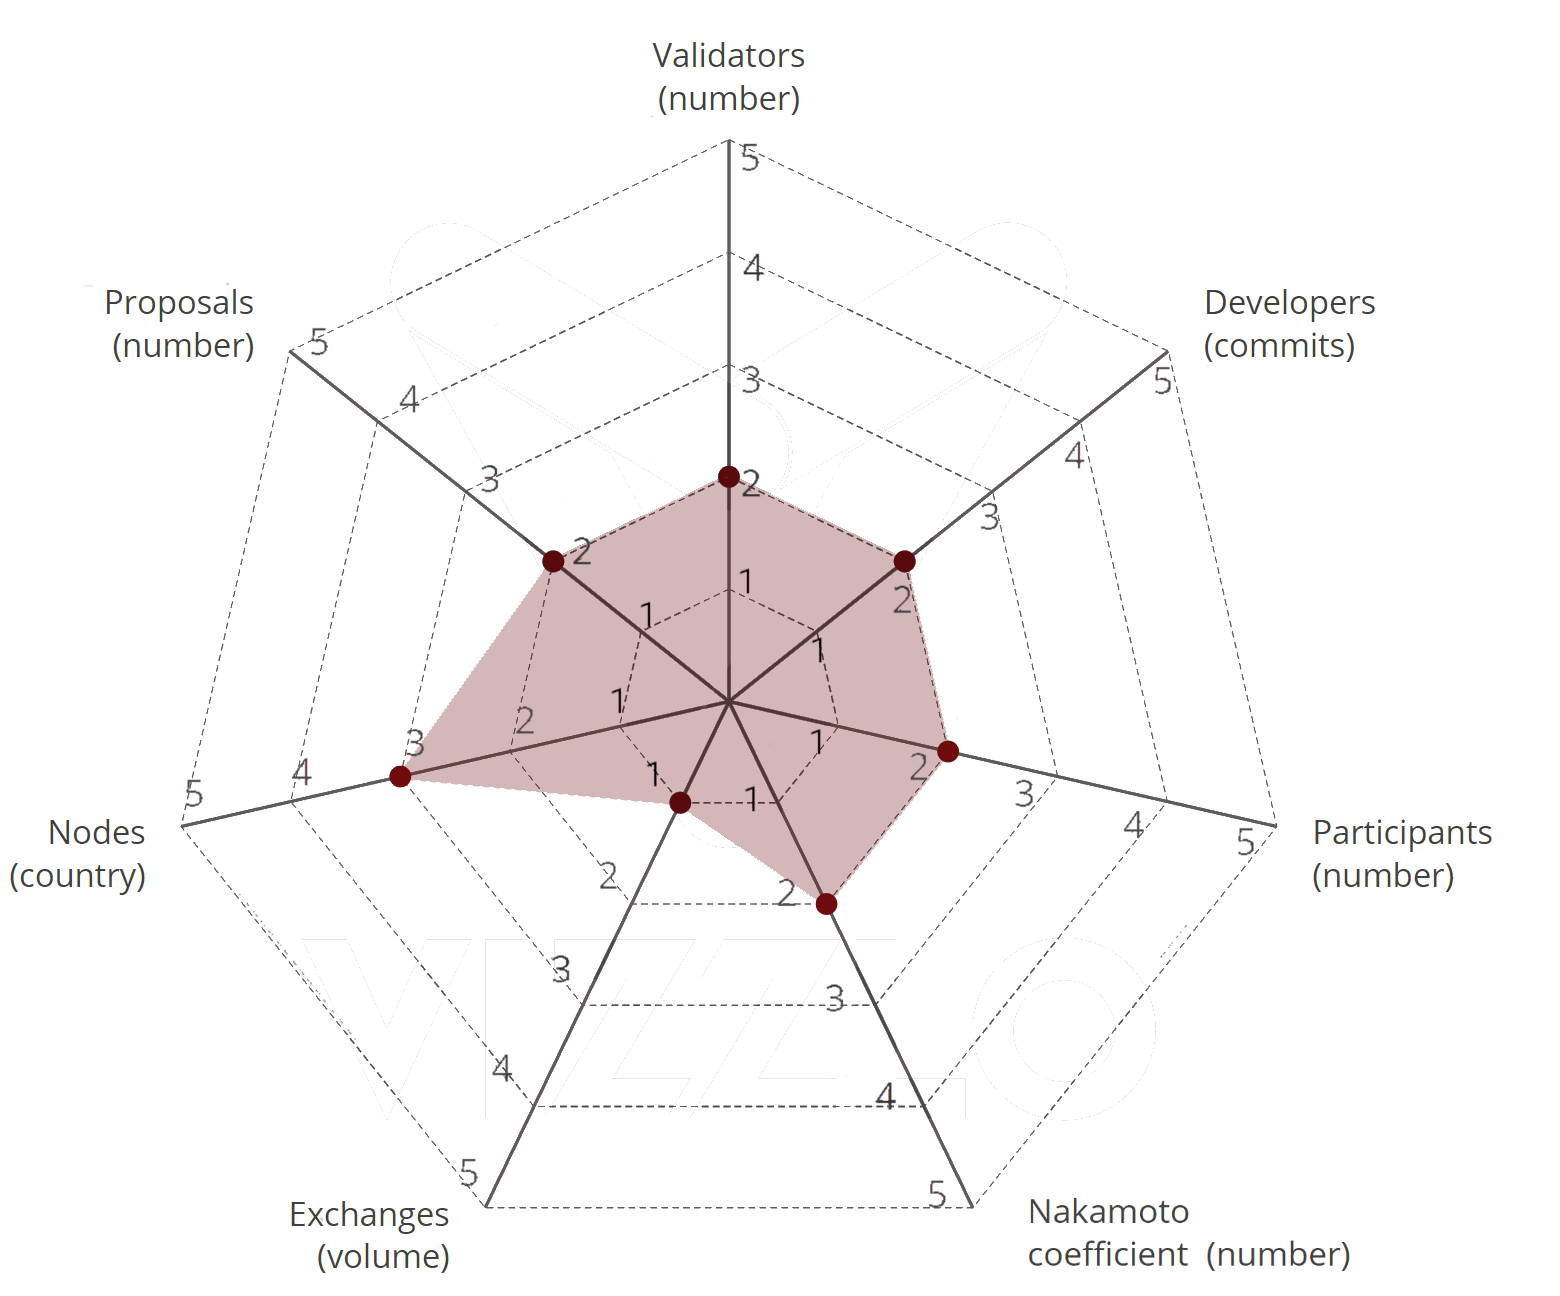
This score will quickly begin to shift after launch as decisions on the Network begin to be made by the consensus of the Network, more Partipicants and Node Operators join, and as the Network becomes more geographically diverse.
Where we want to get to
We are aiming for High Entropy for various reasons because it:
- Correlates with higher Network security and resiliency across countries;
- Means broader contributions to the Network from a multidisciplinary and diverse collective;
- Enables increased integration capabilities with other technologies to improve the ecosystem as a whole;
- Increases the democratisation of wealth and dilution of rewards across a larger scope of actors;
- Dilutes the control from a select group of people, to a genuinely decentralised and diverse collective.
As a benchmark, we want to aim for an Entropy Score greater than 28; and with none of the scores below Entropy Level 3.
This combination is important because it will ensure that there is a limited surface area for centralised control, as all metrics have progressed beyond a Low Entropy state.
A High Entropy Network would generate a scorecard illustrated by the example below:
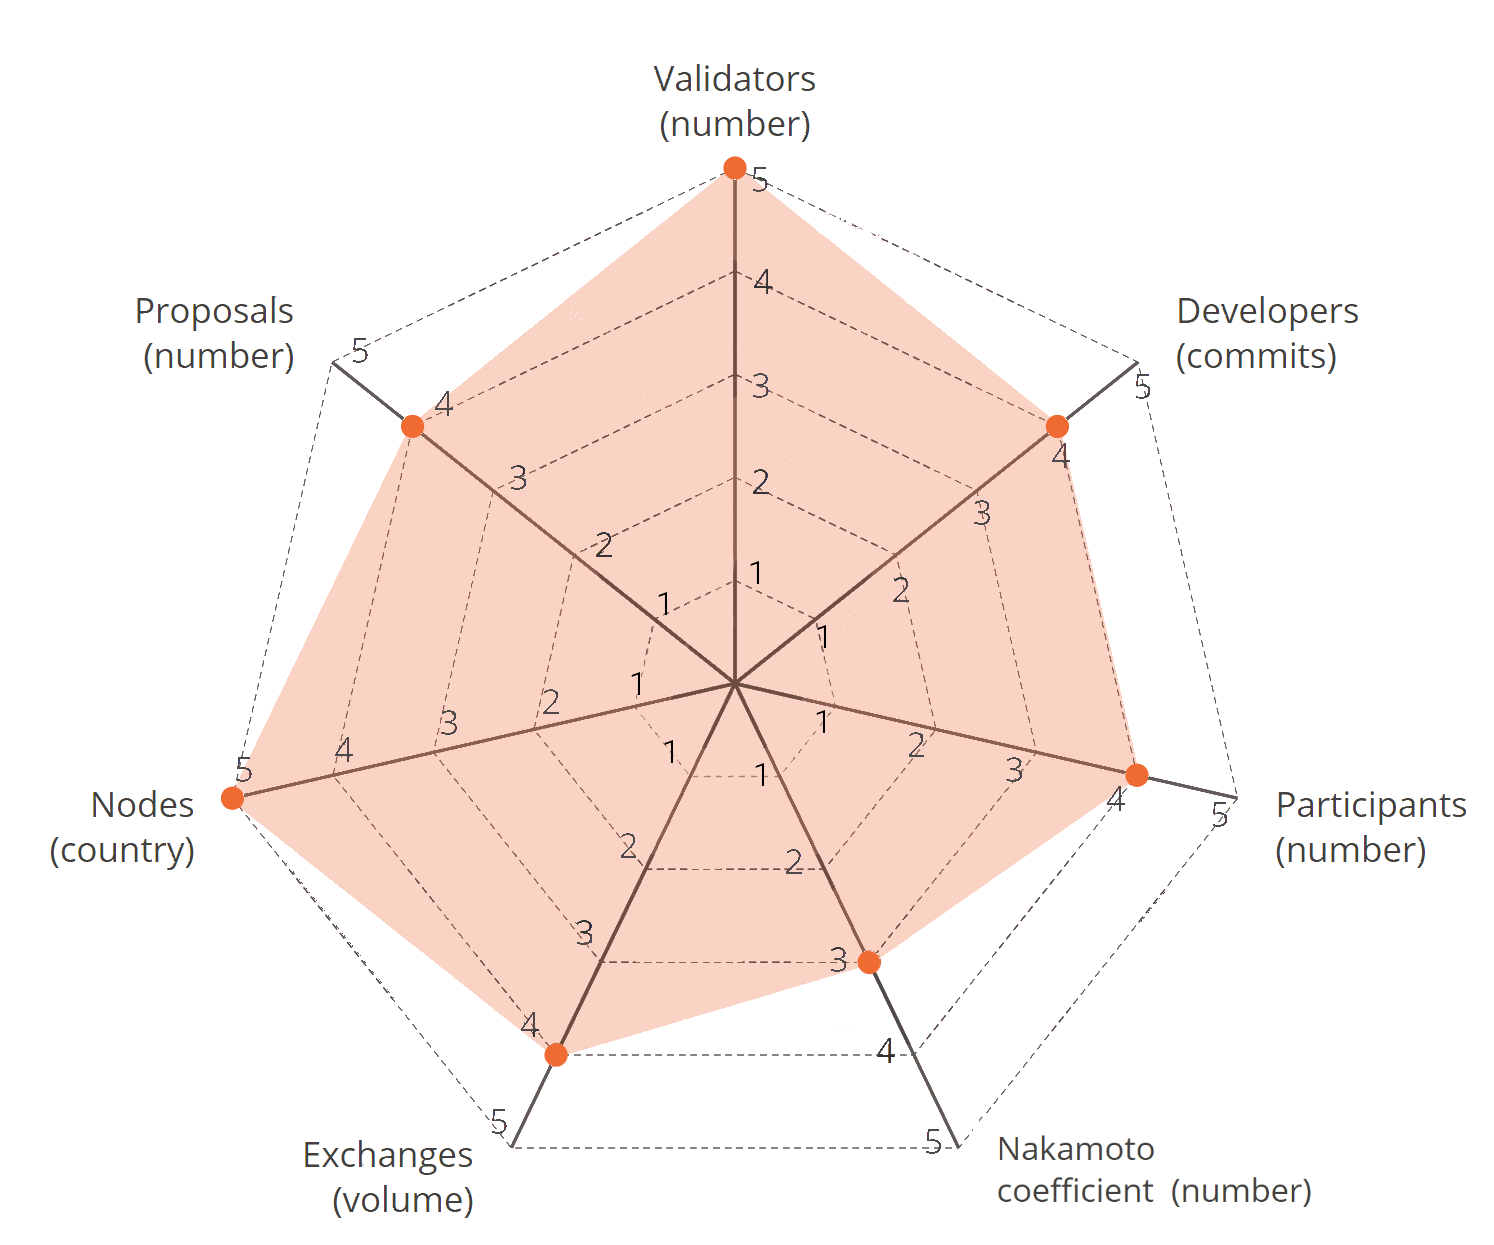
At this point of High Entropy, we would hope that we would be considered a Network that is sufficiently decentralised (although of course, this is not up for us to decide).
Nonetheless, we believe that this progression of Low to High Entropy is an important journey for every decentralised Network to embark on and we believe that we have provided a sensible set of parameters to aim for.
How do we plan to get there?
To increase Entropy, we have developed a Governance Framework that champions decentralisation as time progresses.
Achieving High Entropy involves:
- Making it easy for Node Operators to onboard in an Open Source way;
- Having clear and transparent documentation, in multiple languages;
- Having simple governance processes to evolve the Network baked into the protocol;
- Incentivising a healthy community, with places to discuss positive and constructive ideas.
- Enabling all parties to be remunerated for their active contribution and participation.
And a combination of the above will increase the Network Entropy in a healthy and natural way, bridging the middle ground between Low and High Entropy, as seen below:
As the initial team, we have a responsibility to, as we like to put it, create the first domino and push it over to start a chain reaction. Or in other terms, we need to take care in setting a strong technical foundation alongside a culture of transparency, inclusivity and open communication to begin the transition of Entropy in the right direction.
If this is done correctly, cheqd should converge to a point of decentralisation where the onus of control does not rely on any specific entity.
Where does this leave us?
Over the course of this series of blogs, we have introduced and explained the following:
- Why decentralisation is an important goal for healthy blockchain Networks;
- Why Increasing Entropy is an important concept in achieving this goal;
- How to model Entropy to achieve greater clarity.
This can all be encapsulated in our short video, explaining Entropy as an analogy here:
And looking back now, what we want the reader to take away from this is to understand the following:
Decentralised Networks and Decentralised Autonomous Organisations (DAOs) often leave a lot to be desired, especially when it comes to clearly defined lines.
Through our model of Entropy, we incentivise healthy Network behaviour, high resiliency, utility and generativity — which should be the building blocks for any decentralised Network.
We also want this model to move decentralised governance structures and DAOs towards having greater regulatory clarity, by laying out a sensible framework and sensible benchmark metrics to achieve decentralisation on cheqd.
Helping frame decentralised ecosystems in a way that makes sense for laypersons will bolster the chances of SSI and token payment rails being used in regulated industries worldwide.
We hope the community can iterate and build on the work done here and respond with feedback and opinions. This eventually can create an even more robust framework and help make cheqd’s vision of Web 3.0, the new paradigm for human interaction and transaction.
We hope you have enjoyed this series, stay tuned for more by following us on Twitter, Telegram and LinkedIn to be the first to hear our latest updates, and on Medium to follow our content and thought leadership.
Or if you want to ask any governance-specific questions, you can engage with us in our governance discussion forum, here.